Do the Covid vaccines work? Yes, to a degree. But, what do the statistics show? How effective are they? Apparently, not as effective as governments claim. Here’s what I found. Generally speaking, the lower the vaccination rate in a country, the lower the number of cases of covid in that country. And, generally speaking, the higher the number of vaccinations, the higher the number of covid cases. I was surprised.
The following information compares the percentage of the population that has been vaccinated along with the total cases per million of that same population. I took my data from two sources: 1) https://ourworldindata.org/covid-vaccinations?country= and 2) https://www.worldometers.info/coronavirus/. I did not select data that was favorable to any conclusion and did not know the outcome of the analysis. The source files contained all countries. I picked what I thought would be 20 representative countries and collected the data, and have represented them below. 
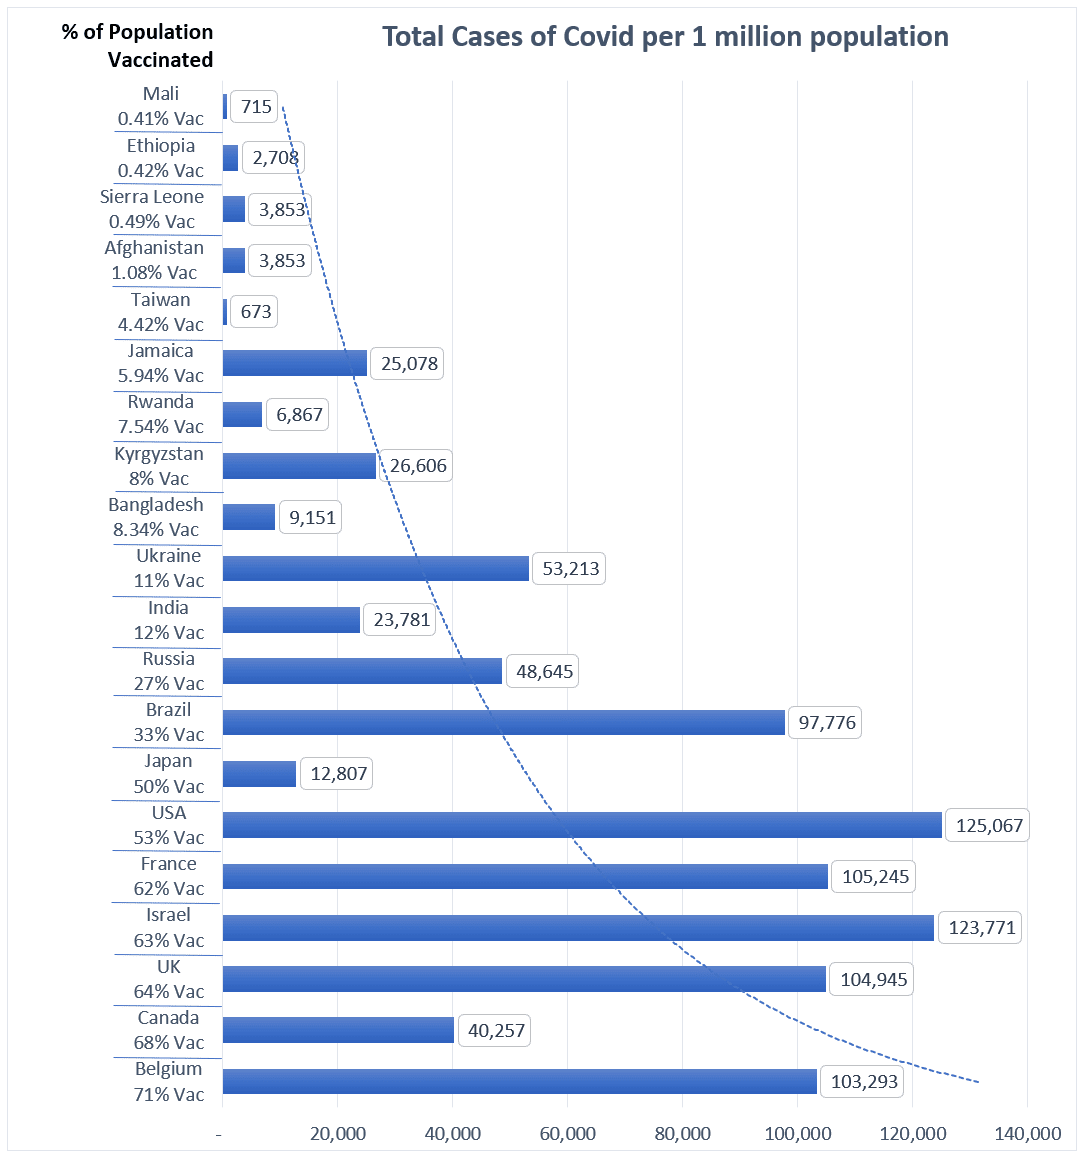
Please take a look at both the table and the graph below. I tried to make the information as easy to understand as possible. The graph below is the visual representation of the table.
In my opinion, the effectiveness of the covid vaccines is in doubt, and the evidence could even suggest that taking the vaccines may increase covid infections. I don’t know how else to conclude based on my research. Now, that is my opinion, and as I have already stated in the disclaimer, the information I’ve produced here is not to be used for medical decisions.
| SORTED BY % OF POPULATION FULLY VACCINATED TO DETERMINE COVID VACCINE EFFECTIVENESS |
|||
| Country | % of population fully vaccinated |
Total Cases per 1 Million population |
% of Cases per 1 Million population |
| Belgium | 71% | 103,293 | 10.3% |
| Canada | 68% | 40,257 | 4.0% |
| UK | 64% | 104,945 | 10.5% |
| Israel | 63% | 123,771 | 12.4% |
| France | 62% | 105,245 | 10.5% |
| USA | 53% | 125,067 | 12.5% |
| Japan | 50% | 12,807 | 1.3% |
| Brazil | 33% | 97,776 | 9.8% |
| Russia | 27% | 48,645 | 4.9% |
| India | 12% | 23,781 | 2.4% |
| Ukraine | 11.2% | 53,213 | 5.3% |
| Bangladesh | 8.34% | 9,151 | 0.9% |
| Kyrgyzstan | 8.00% | 26,606 | 2.7% |
| Rwanda | 7.54% | 6,867 | 0.7% |
| Jamaica | 5.94% | 25,078 | 2.5% |
| Taiwan | 4.42% | 673 | 0.1% |
| Afghanistan | 1.08% | 3,853 | 0.4% |
| Sierra Leone | 0.49% | 3,853 | 0.4% |
| Ethiopia | 0.42% | 2,708 | 0.3% |
| Mali | 0.41% | 715 | 0.1% |
|
|||
The following graph is taken from the table above. You can see the general progression that the more vaccinations there are, the more covid cases occur. But, the sorting is reversed so that the least vaccinated country is at the top and the most vaccinated is at the bottom. Scientists should do more research to find out why covid cases are lower in lower vaccinated populations. But, for now, this is what I’ve found.
(Please read the CARM disclaimer regarding Covid related issues.)